Smart Cities Observatory
IMD WORLD COMPETITIVENESS CENTER-Ranking of 142 cities

Since 2019, the IMD Global Competitiveness Centre has compiled an annual Smart City Index, which offers a balanced focus on the economic and technological aspects of smart cities on the one hand and the “human dimensions” (quality of life, environment and inclusion) on the other.
The team consists of: Arturo Bris, Professor of Finance and Director of the IMD World Competitiveness Centre – Ilrundo di Lanvin, President of the Smart City Observatory at IMD – Christos Cabolis, Professor of Economics and Competitiveness and Chief Economist and Head of Operations at the IMD World Competitiveness Center. José Caballero Senior Economist – Marco Pistis Specialist Researcher and Maryam Zargari Specialist Researcher, who, with the statements of the citizens surveyed, the data collected in the cities and various partners, provide us with a ranking of no fewer than 142 cities worldwide for comparison.
A look at the comparative methodology used
The IMD website also gives us an insight into the methodology used and summarises the 7 most important steps.
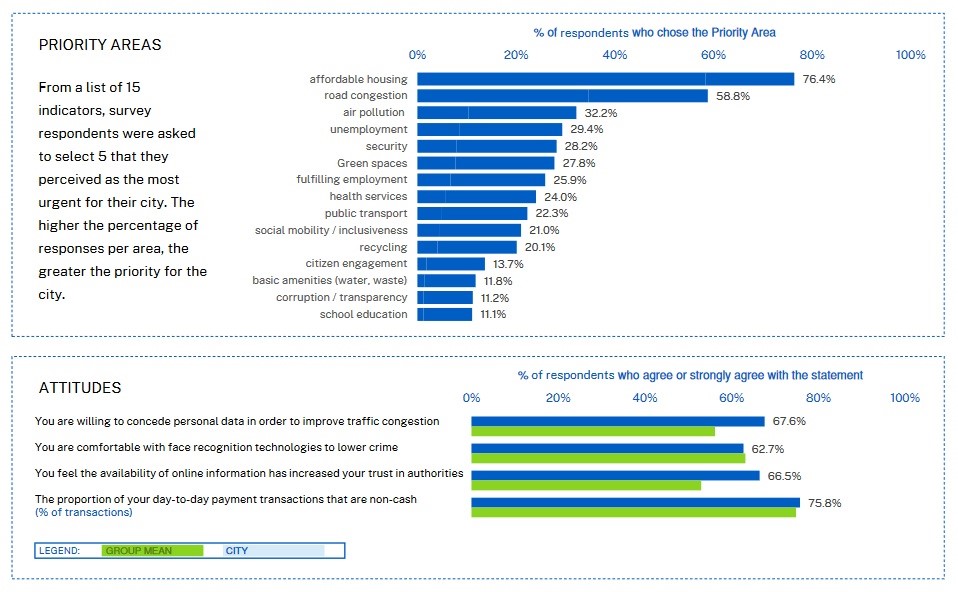
1) The IMD Smart City Index 2024 assesses residents’ perceptions of the facilities and technology applications available to them in their city.
2) In this edition of the SCI, 142 cities worldwide are ranked by capturing the perceptions of 120 residents in each city. The final score for each city is calculated using the perceptions from the last three years of the survey, with a weighting of 3:2:1 for 2024:2023:2021.
3) There are two pillars for which residents’ perceptions are surveyed: the Facilities pillar, which refers to the cities’ existing infrastructure, and the Technology pillar, which describes the technological offerings and services available to residents.
4) Each pillar is assessed in five key areas: Health and Safety, Mobility, Activities, Opportunities and Governance.
5) Cities are categorised into four groups based on the Human Development Index (HDI) of the Global Data Lab to which they belong.
6) Within each HDI group, cities are assigned a “rating scale” (AAA to D) based on the perceived value of a particular city compared to the values of all other cities within the same group. For Group 1 (highest HDI quartile), scale AAA-AA-BBB. For group 2 (second HDI quartile), scale A-BBB-B- CCC. For group 3 (third HDI quartile), scale BB-B-C-C. For group 4 (lowest HDI quartile), scale CCC-C-D.
7) The rankings are then presented in two formats:
- an overall score (1 to 142)
- a score for each pillar and overall
The ranking
Now you may be wondering who is on the podium.
As always, our beloved Zurich does not disappoint and takes first place for the fourth year in a row. Followed by Oslo and Canberra.
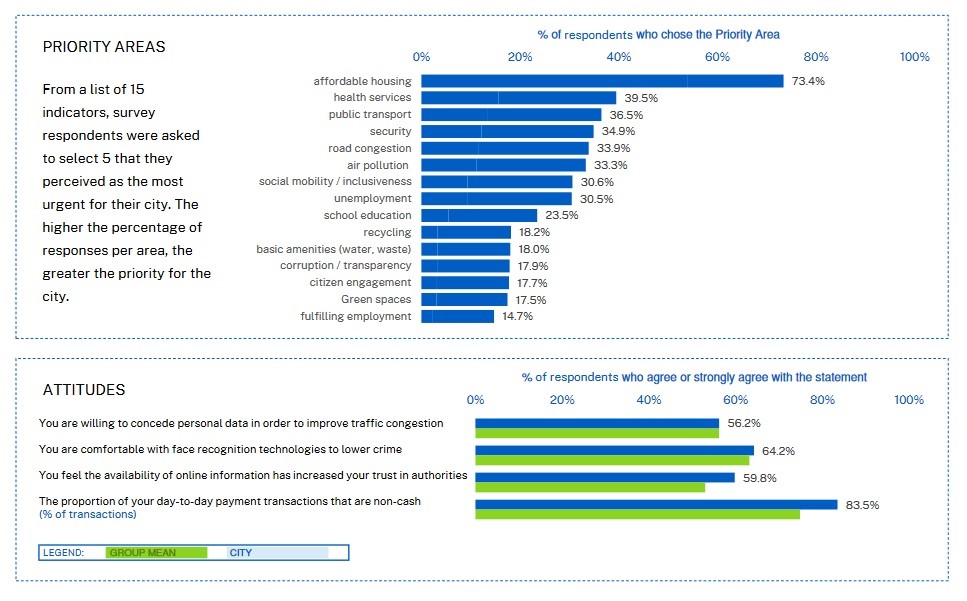
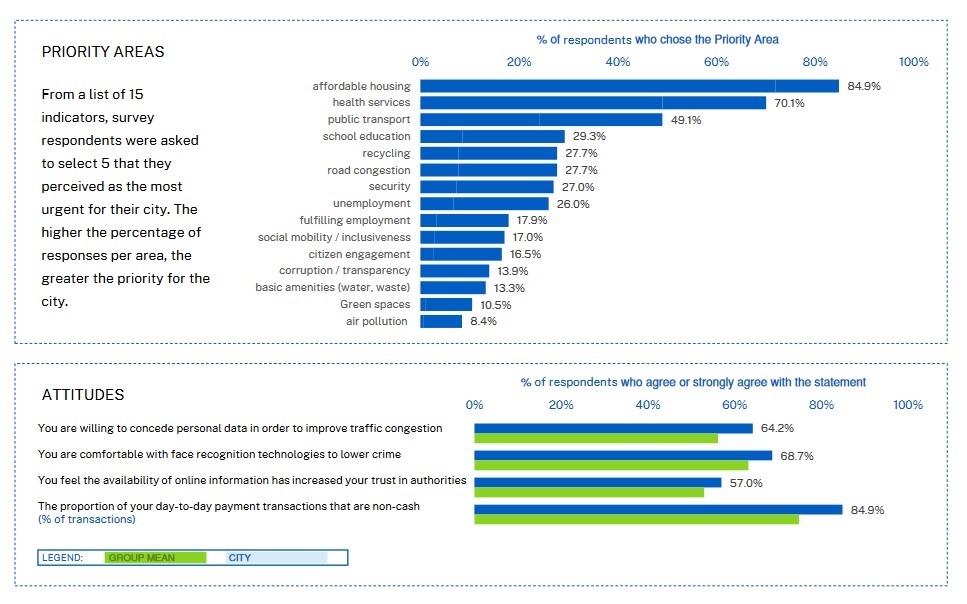
Let’s now analyse the percentages of the individual subjects.
Zürich
Oslo
Canberra
You can find more facts and figures at: https://www.imd.org/smart-city-observatory/home/rankings/#_tab_Rank
From this we can conclude that: Whether you are looking for a primary residence, a capital investment or a commercial property project, Zurich is the place for you and anfina real estate agency is always ready to provide you with the right offers in the city!